
Cluster Analysis on road collisions in Montréal
Last updated 2025-27-11
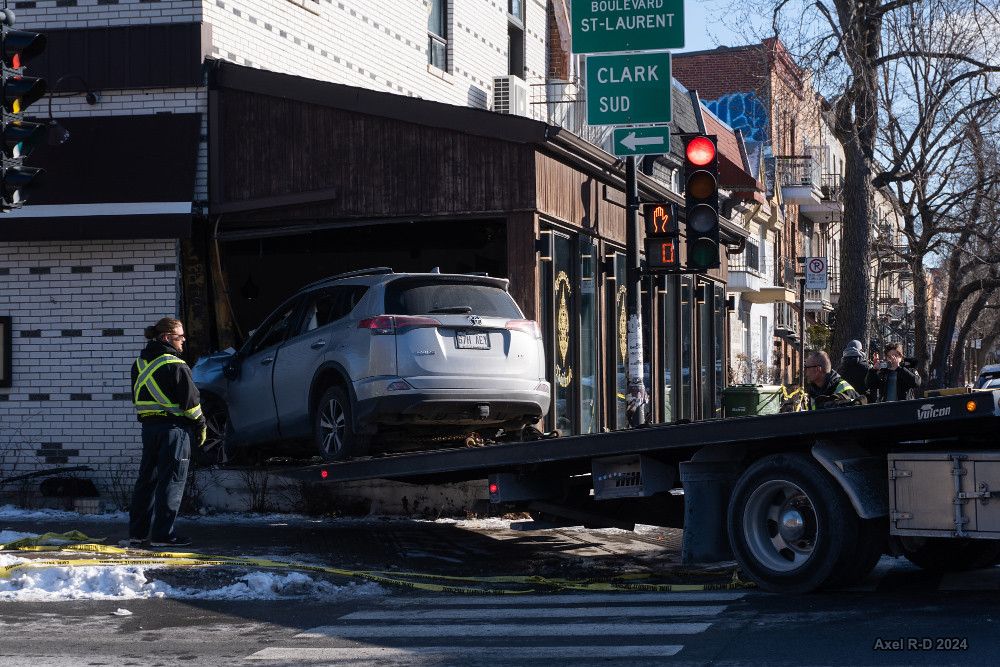
Road collisions happen often in Montréal, with 14,210 recorded collisions on the island in 2021 alone, 26 of which fatalCollisions routières - Site web des données ouvertes de la Ville de Montréal. (Ville de Montréal, 2022)Collisions routières - Site web des données ouvertes de la Ville de Montréal. (Ville de Montréal, 2022). We want to see whether the values of median household income and children population density can be used to predict theroad collision density across Statistics Canada's Census Tracts on the Island of Montréal.
Economic conditions could influence the risk-taking behaviour in driving, where higher speed and load were seen as one way to optimise the work of taxi and minibus drivers Socio-economic determinants of road traffic accident fatalities in low and middle income countries. (Grimm et al., 2010)Socio-economic determinants of road traffic accident fatalities in low and middle income countries. (Grimm et al., 2010). Road traffic accident is a leading cause of death for children, and traffic accident fatality in Montréal is increased for people under 24 and above 75 years oldRoad Traffic Accidents and Disparities in Child Mortality. (Mokdad et al., 2020)Road Traffic Accidents and Disparities in Child Mortality. (Mokdad et al., 2020)Pertes de Vie et Blessures Par Accidents de la Route Chez les Piétons à Montréal et à Toronto. (Thouez et al., 2003)Pertes de Vie et Blessures Par Accidents de la Route Chez les Piétons à Montréal et à Toronto. (Thouez et al., 2003).
Methodology
We use publicly available data from the Montréal municipal government for the island administrative polygon boundaries and collision data pointsCollisions routières - Site web des données ouvertes de la Ville de Montréal. (Ville de Montréal, 2022)Collisions routières - Site web des données ouvertes de la Ville de Montréal. (Ville de Montréal, 2022). In addition, we use the 2021 federal census data for the census tract polygons, median household income after tax, and children population table2021 Census Boundary files. (Statistics Canada Government of Canada, 2021)2021 Census Boundary files. (Statistics Canada Government of Canada, 2021).
Since a significant portion of accidents happens on roads which happens to be census tract boundaries, we evenly divide collision count to census tracts nearby, keeping the total sum constantComparing the road safety of neighbourhood development patterns: traditional versus sustainable communities. (Sun et al., 2013)Comparing the road safety of neighbourhood development patterns: traditional versus sustainable communities. (Sun et al., 2013). We decided to use 10 metres as the distance limit where a census tract can be considered near a collision point. Furthermore, we standardise the children population and collision data points by census tract area to address the Modifiable Area Unit Problem, resulting in children population density and collision density.
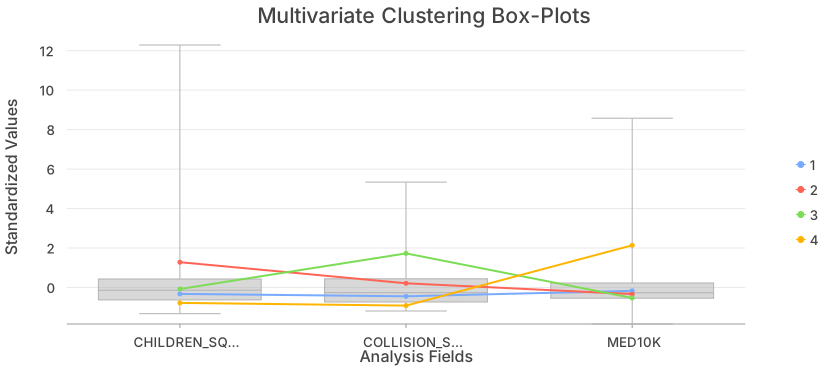
We ran an unconstrained k-means multivariate cluster analysis with 4 clusters to classify the census tracts and see the patterns of our variables without considering spatial properties. Spatially constrained methods with contiguity constraints does not fit well with our area of interest, since we have several disconnected landmasses. We also do regression analysis with queen contiguity using ordinary least squares (OLS), geographically weighted regression (GWR), spatial lag model (SLM), and spatial error model (SEM) to see if there are significant trends in our data.
Results
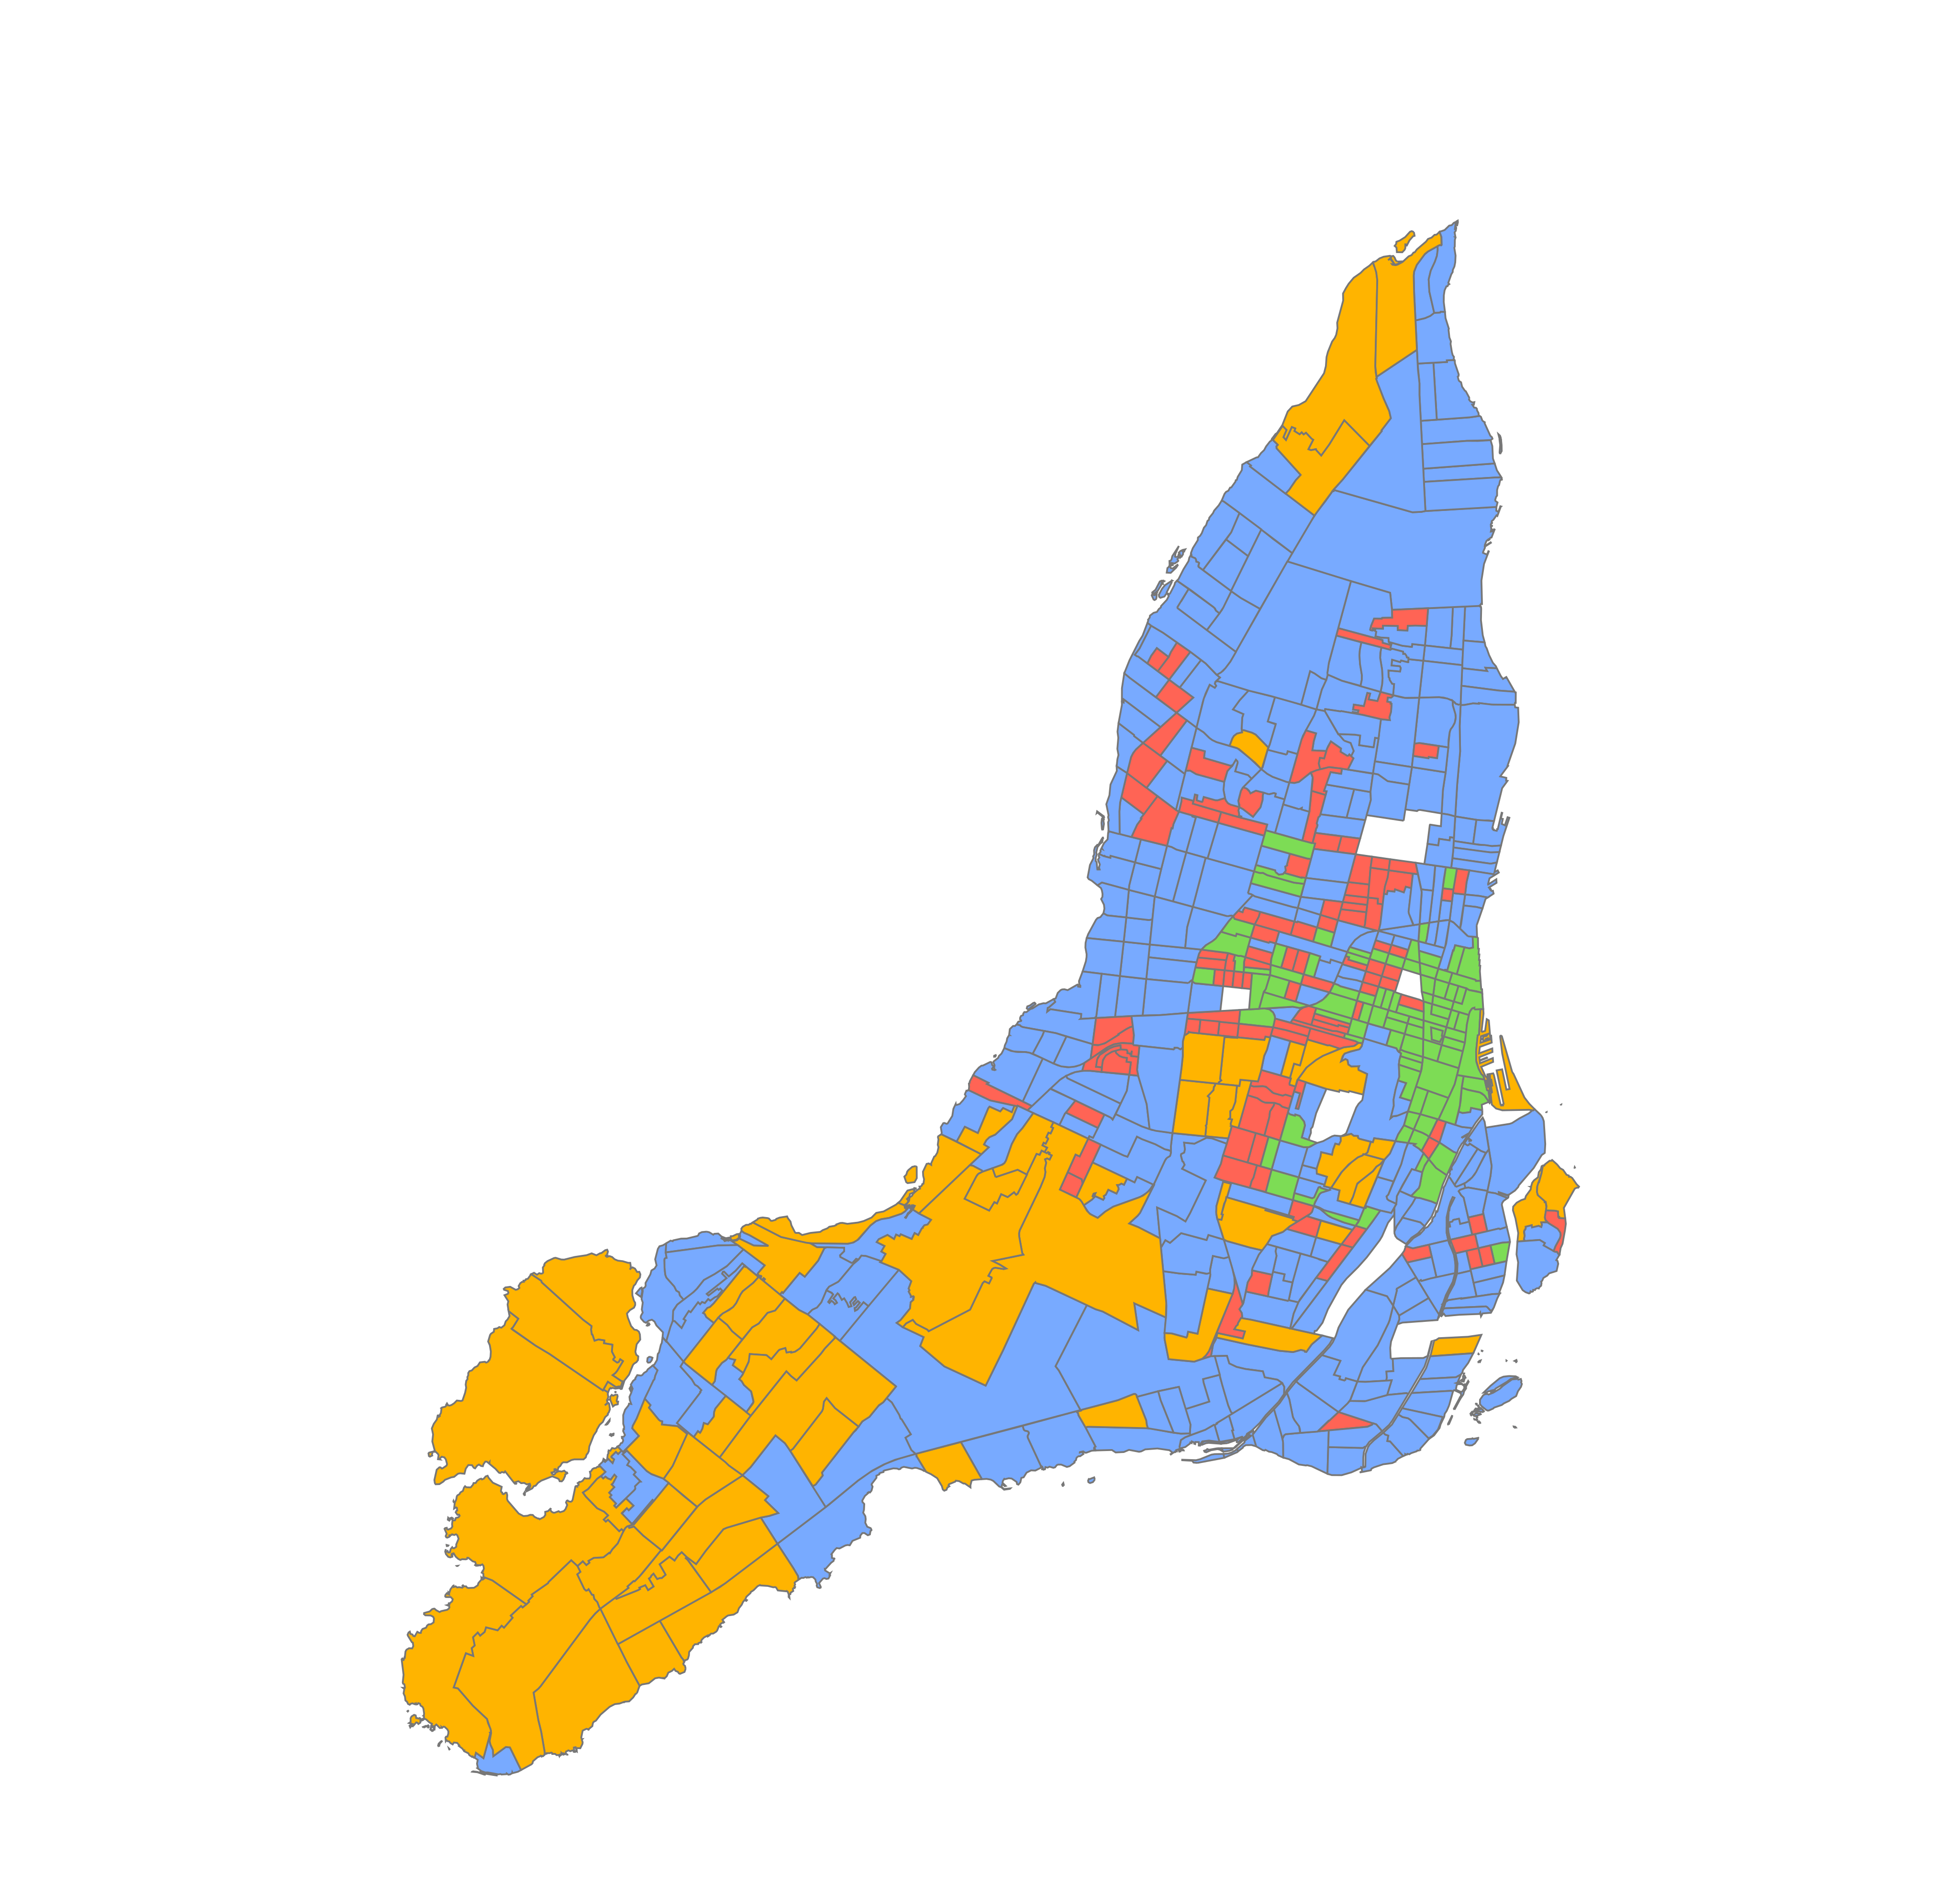
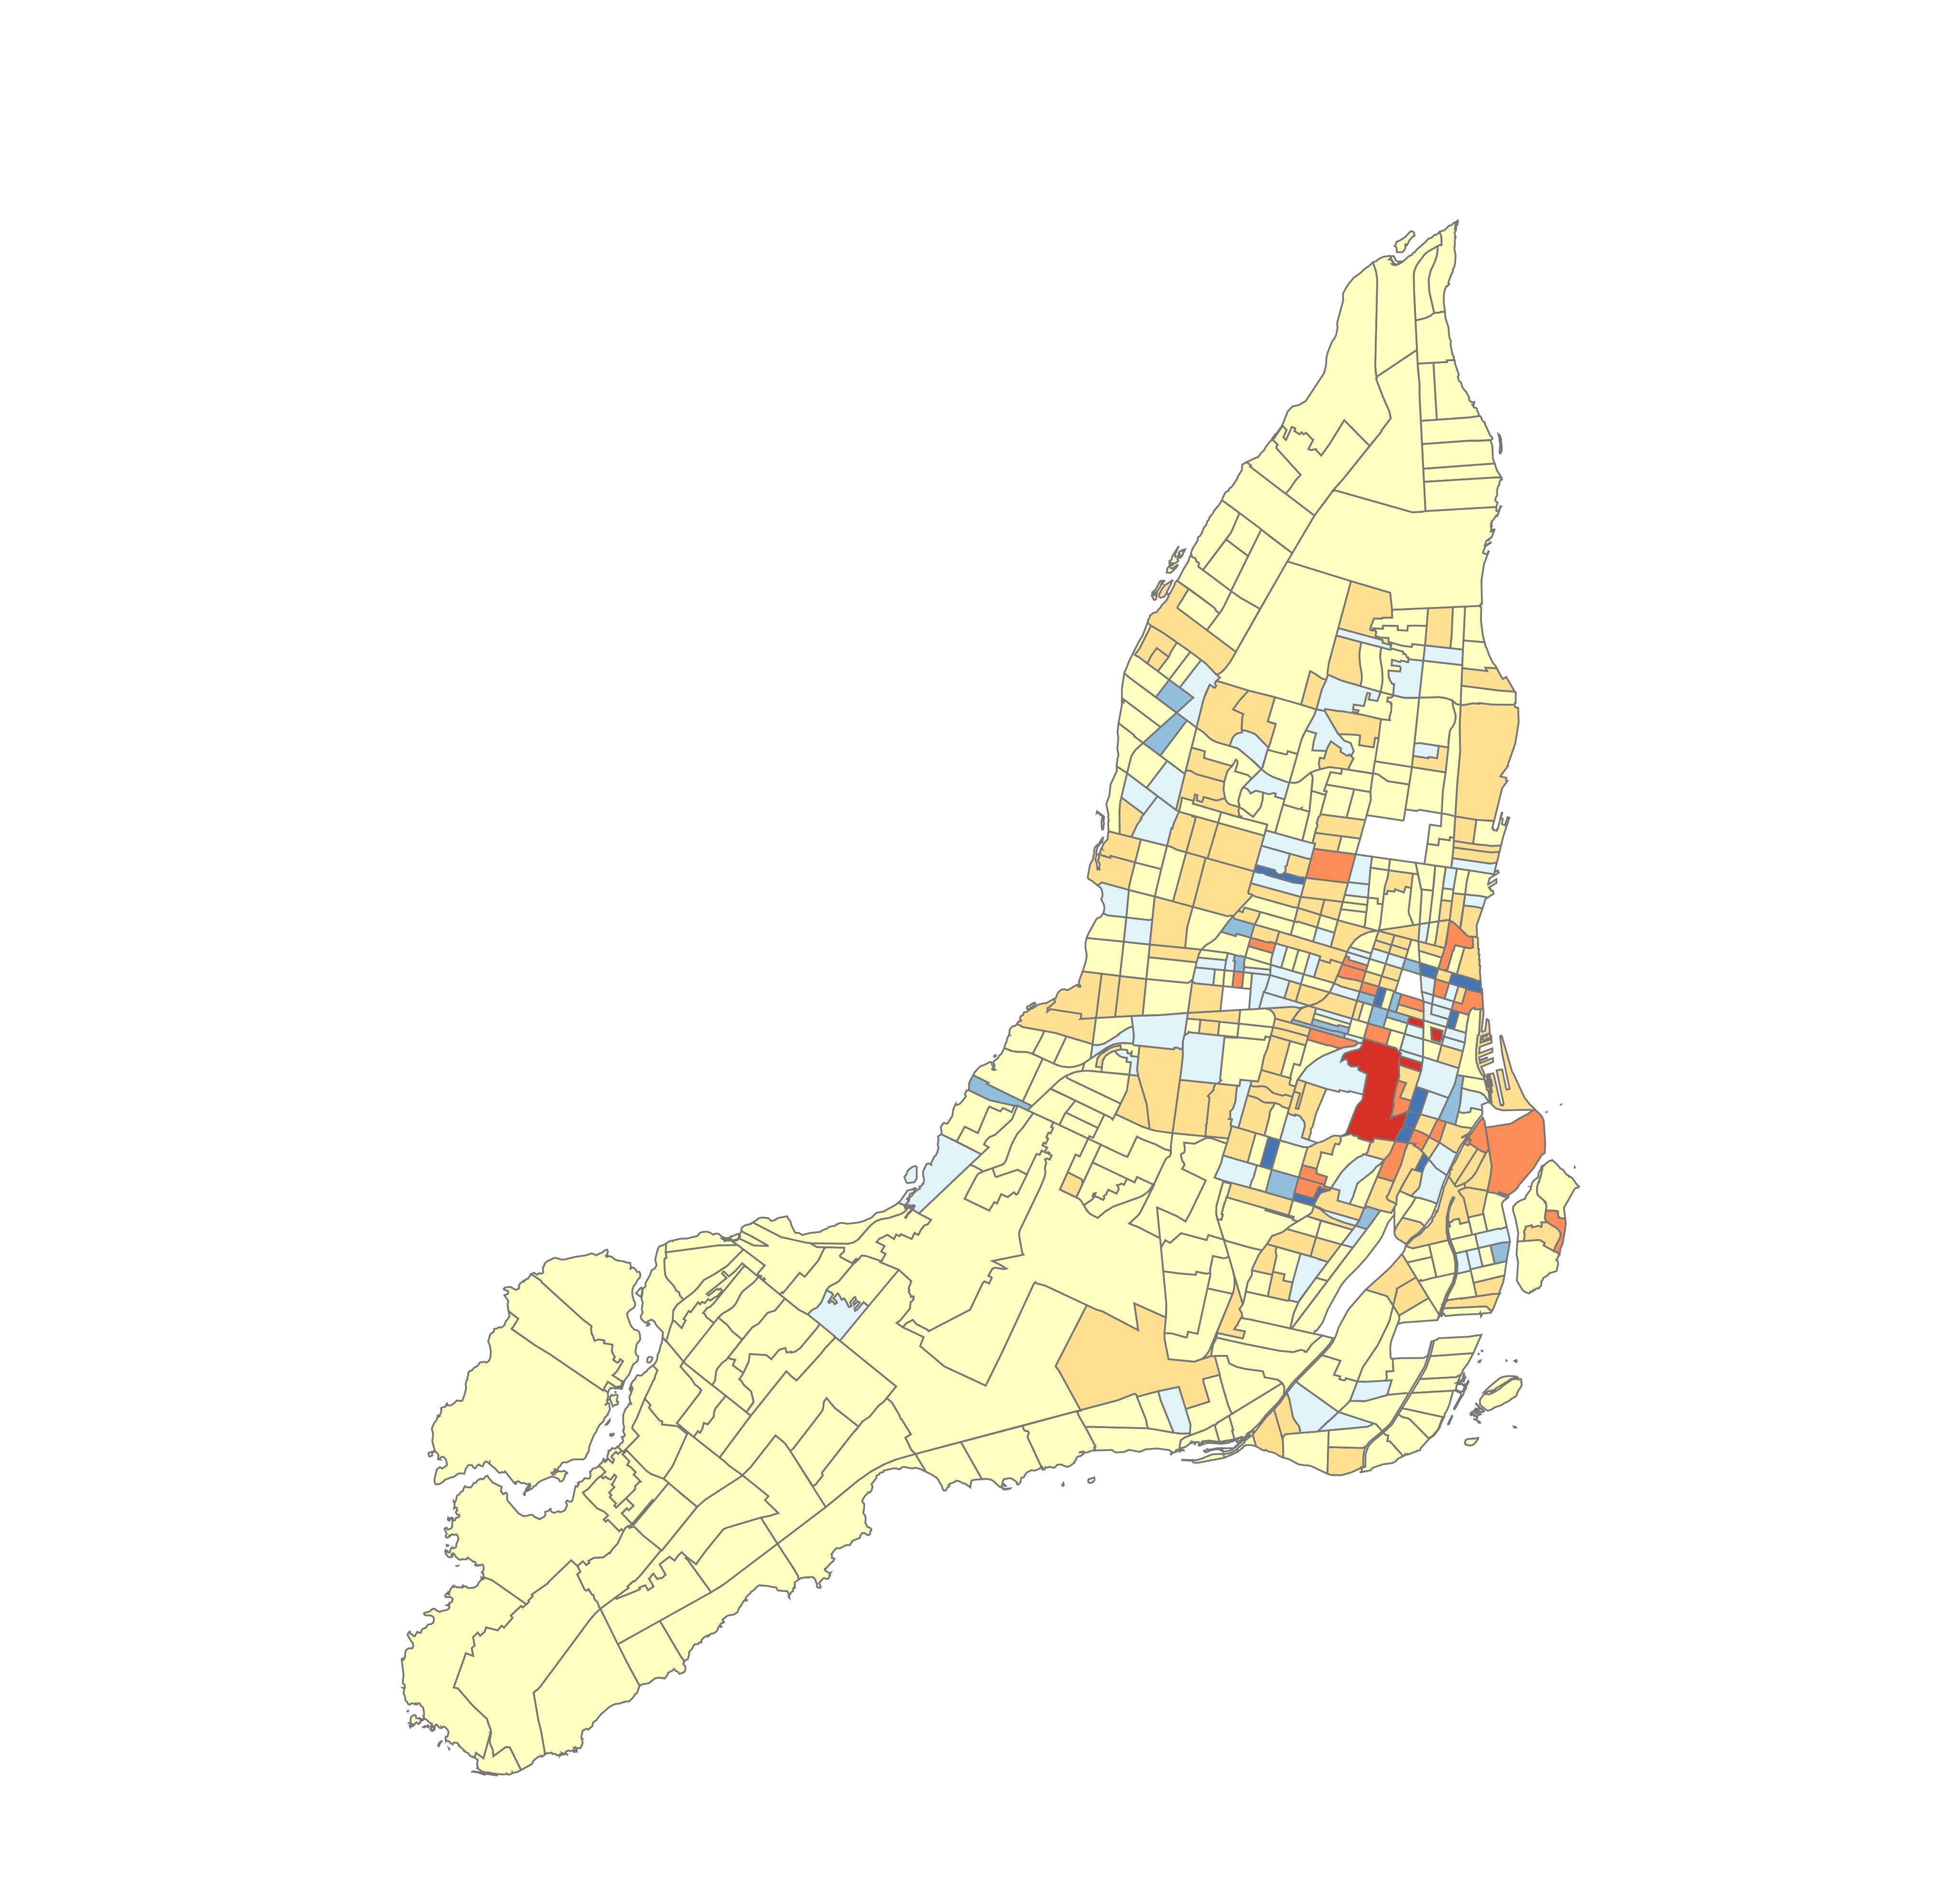
The map below shows us the clustering map from our unconstrained k-means multivariate cluster analysis, and this boxplot shows us the values for each group. The three variables distribution resembles normal distribution, with very weak linear relationships between any two with . This table shows the results of our regression analysis, with the residual map for GWR shown on the map. Furthermore, we have a significant spatial error and spatial lag dependence for our weight matrix.


| Model | Model fit | Intercept | MED10K coefficient | CHILD_SQKM coefficient | Spatial dependence | AICc |
|---|---|---|---|---|---|---|
| OLS (*) | 0.19 | 1752.97 | -149.45 | 0.09 | no | 8461.56 |
| GWR | 0.80 | N/A | N/A | N/A | no | 7977.84 |
| SLM | 0.68 | 317.01 | -36.54 | 0.08 | yes | 8222.36 |
| SEM | 0.67 | 826.72 | -21.64 (!) | 0.10 | yes | 8241.15 |
Discussion
The clustering shows an inverse relationship between median household income and collision density and positive relationship between children density and collision density (excepting cluster 2). The regression analysis seems to support this idea. Two regressions with global coefficients and intercept SLM and SEM agree that child density has a positive coefficient. SLM also assigns median household income a negative coefficient, showing an inverse relationship.
Unfortunately the OLS results are not valid, since there is no linear relationships between children density and collision density or median household income and collision density. GWR is the strongest model, assigning special intercept and coefficients for each census tract with model fit 0.80.
The clustering shows that high collision density area is concentrated downtown, while the affluent West Island has low collision density. Even though GWR successfully models the two ends of the island, it struggles to model the downtown area especially around the Concordia University area. The significant spatial error and spatial lag dependence means that the relationships between variables is spatially non-stationary, being influenced by the neighbouring areas.
Conclusion
In predicting road collision density over census tracts in Montréal island, there is a positive relationship with children population density and a negative relationship with median household income. The effect is spatially non-stationary, which agrees to Tobler's First Law of GeographyA Computer Movie Simulating Urban Growth in the Detroit Region. (Tobler, 1970)A Computer Movie Simulating Urban Growth in the Detroit Region. (Tobler, 1970). If we want to mitigate the number of road collisions in the island, we should look first to poor areas with lots of children, as they are the most vulnerable ones.
Bibliography
- Ville de Montréal, 2022. Collisions routières - Site web des données ouvertes de la Ville de Montréal.
- Grimm et al., 2010. Socio-economic determinants of road traffic accident fatalities in low and middle income countries. ISS Working Paper Series / General Series.
- Mokdad et al., 2020. Road Traffic Accidents and Disparities in Child Mortality. Pediatrics.
- Thouez et al., 2003. Pertes de Vie et Blessures Par Accidents de la Route Chez les Piétons à Montréal et à Toronto. Canadian Journal of Urban Research.
- Statistics Canada Government of Canada, 2021. 2021 Census Boundary files.
- Sun et al., 2013. Comparing the road safety of neighbourhood development patterns: traditional versus sustainable communities. Canadian Journal of Civil Engineering.
- Tobler, 1970. A Computer Movie Simulating Urban Growth in the Detroit Region. Economic Geography.